In a world of ever‑changing markets and a torrent of financial information, having a clear, intuitive dashboard can make all the difference. That’s where Google Finance comes into play. Whether you’re a casual investor checking your portfolio, a budding financial writer looking up company statistics, or a seasoned analyst needing quick access to market data, Google Finance is a valuable tool. This article dives into what it is, how it works, how to make the most of it — and the caveats you should be aware of.
What is Google Finance?
At its core, Google Finance is a web‑based platform operated by Google LLC that offers market quotes, charts, financial news, and tools to track companies and securities. Google+3Google+3Wikipedia+3
A brief history
Launched in March 2006, Google’s initial foray into financial market data. Wikipedia+1
Over the years, the service evolved: in 2020 a redesign focused on investor‑education tools; by 2025, Google announced an AI‑enhanced version of the platform. The Verge+1
Today, Google Finance remains a free, browser‑based resource for tracking equities, indices, currencies and some other asset classes.
Why use it?
Simplicity: Clean interface, easy to navigate — good for non‑professionals.
Integration: If you already use Google search or Sheets, the tool fits nicely into your workflow.
Accessibility: No expensive subscription required for basic usage.
Watchlists and comparisons: Lets you follow securities, compare performance, view news immediately associated with specific tickers. Google Help+1
Key Features and How to Use Them
1. Tracking a stock or security
To look up a company or ticker:
Go to finance.google.com (or via Google search type in the symbol).
Enter the ticker symbol (for example “NASDAQ:GOOG”) or company name.
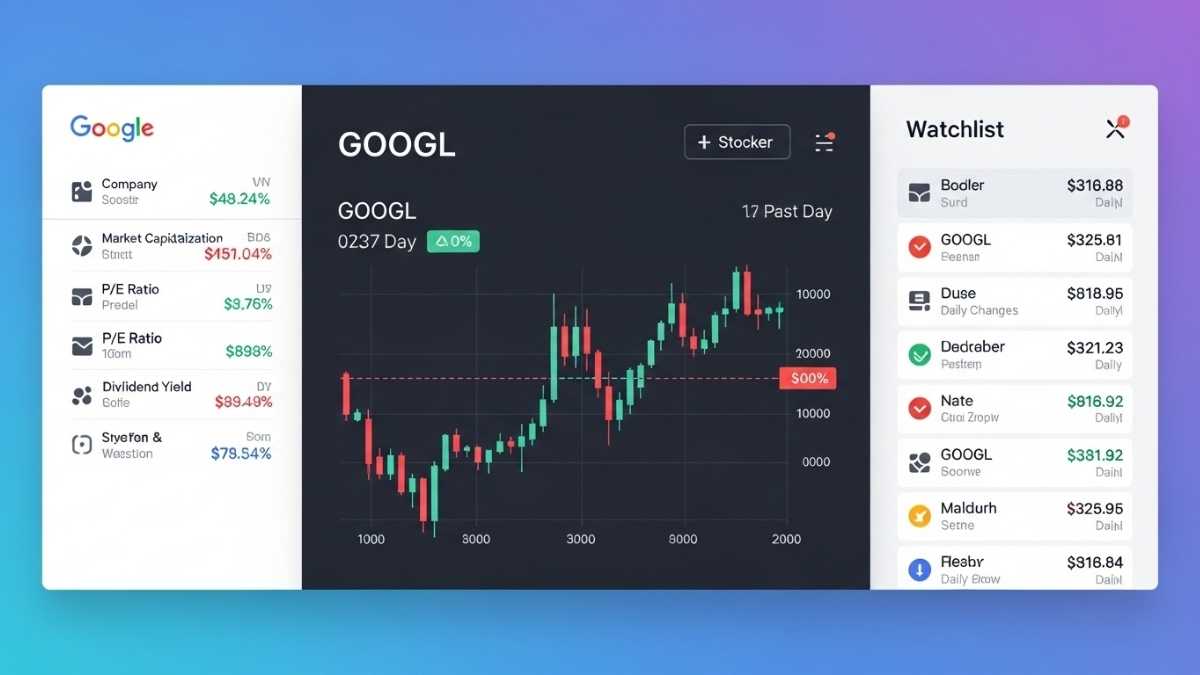
You’ll land on the stock’s overview: real‑time price quote (delayed up to ~20 minutes), market cap, P/E ratio, recent change, and news. Google Help+1
2. Watchlists and following stocks
One of the most powerful features for personal monitoring:
From the security’s page, click Follow to add it to Your Watchlist. Google Help
You can create custom watchlists (e.g., “Tech Growth”, “Dividend Plays”).
Within your watchlist you can see recent performance and news stories related to those securities.
3. Comparing securities
If you want to compare how two (or more) stocks perform relative to each other:
On a stock’s page you’ll find a option to Compare.
Select another security and you’ll see a combined chart showing both. This helps in benchmarking one investment against another. Google News Initiative+1
4. Historical data and charts
Want to dig into past performance?
Use the stock’s overview to scroll to its historical chart — choose time frames (1 day, 1 month, 5 years etc.).
For spreadsheet users: the function GOOGLEFINANCE (Sheets) (in Google Sheets) lets you fetch historical price, volume and other attributes. Google Help
Here’s the syntax:
That example pulls daily closing price for GOOG during 2014.
5. News and additional context
Google Finance integrates news stories relevant to the security or market you’re viewing. This means you don’t just get the numbers, but a sense of what might be driving them. The recent redesign added a live news feed and plans to include more asset types (e.g., cryptos, commodities) in the data podium. The Verge+1
How to Get the Most Value: Practical Tips
Tip 1: Create focused watchlists
Rather than following dozens of stocks indiscriminately, build meaningful categories:
Core holdings (your long‑term investments)
Speculative plays (shorter‑term, higher risk)
Sectors you’re interested in (e.g., renewable energy, fintech)
Organizing this way helps keep track of what matters and avoid information overload.
Tip 2: Use Google Sheets to build dashboards
You can pull live or historical data into Sheets using the GOOGLEFINANCE function. Then:
Build sparklines or mini‑charts to quickly visualize price trends.
Combine with other formulas like
AVERAGE,STDEV, or even custom alerts (e.g., highlight when price falls below a threshold).Automate refreshes if you set up triggers or connected apps (with caveats on update frequency).
Tip 3: Compare stocks wisely
When comparing two companies, make sure you’re not apples‑to‑oranges:
Match similar sectors or business models (e.g., compare two industrials rather than an industrial vs a biotech).
Look at total return including dividends, not just price appreciation, if your platform allows.
Use the chart and then dig deeper into fundamentals (which Google Finance may surface, but you may still need more complete sources).
Tip 4: Leverage the news integration
When you see a price move — good or bad — scroll to the news section on the security’s page:
A headline might explain the move (earnings surprise, regulatory risk, major acquisition).
Consider setting browser alerts or custom Google Alerts for your key holdings so you’re notified of relevant developments.
Tip 5: Be aware of limitations
No tool is perfect. With Google Finance keep in mind:
Real‑time data may be delayed (up to ~20 minutes). Google Help+1
Some asset classes (options, bonds, certain foreign exchanges) may not be fully covered. Wikipedia+1
Advanced technical analysis (many indicators, drawing tools) is limited compared to professional platforms. Wikipedia
Always verify before making important investment decisions — this tool provides data, not advice.
The Spreadsheet Power‑User’s Playground
If you’re comfortable with Google Sheets, the GOOGLEFINANCE function opens up a world of possibilities:
Basic examples
=GOOGLEFINANCE("NASDAQ:MSFT")— by default returns the real‑time price.=GOOGLEFINANCE("NASDAQ:MSFT", "marketcap")— returns Microsoft’s market cap. Google Help=GOOGLEFINANCE("NASDAQ:MSFT", "price", TODAY()-30, TODAY(), "DAILY")— returns daily closing prices for the past 30 days.
Ideas you can build on
Portfolio tracker: List your holdings in one tab, use
GOOGLEFINANCEto pull current price and compute live value (price × shares).Alert system: Use
IFstatements to flag when a stock’s price falls or rises by a given % in a day.Sector comparison sheet: Pull price data for 10 companies in a sector, compute correlation or relative performance.
Currency conversion dashboard: Use
GOOGLEFINANCE("CURRENCY:USDGBP")to fetch exchange rates and compute portfolio value in another currency.
💡 Pro tip: Combine the results with conditional formatting (green/red for performance), and filters for dates to visualize quickly.
What’s New: The 2025‑Era Enhancements
Google announced that Google Finance is undergoing enhancements to make it more powerful and intelligent:
An AI‑powered chatbot embedded in the interface allows you to ask questions like “How did Tesla perform vs Ford in the past year?” and get synthesized answers. The Verge+1
Advanced charting tools now include candlestick views, moving average envelopes, broader asset coverage including more cryptocurrencies and commodities. blog.google+1
Live, up‑to‑the‑minute news feed is integrated and designed to keep you informed of market‑moving events as they happen. blog.google
These additions are particularly useful for those who are moving beyond the “just check price” stage and want deeper insights with minimal manual work.
When Google Finance Isn’t Enough
While Google Finance is strong for many use‑cases, there are scenarios where you’ll need to supplement it with other tools or platforms:
In‑depth technical analysis: Tools like MetaTrader, TradingView or Bloomberg Terminal offer dozens of indicators, real‑time tick data, drawing tools.
Detailed financial statements and filings: For deep company research, access to SEC filings, footnotes, audit reports may require specialized services.
Real‑time or level‑2 market data: Day traders often need order‑book (level‑2) data, which Google Finance does not provide.
Emerging asset classes: Some niche assets (certain global exchanges, futures, options) may be absent or delayed.
Understanding these gaps lets you use Google Finance for what it does best—and know when to escalate to a more specialised tool.
Best Practices for Using Google Finance Responsibly
Set realistic expectations: It’s a tool for information and monitoring — not a substitute for investment advice.
Double‑check important numbers: Always verify critical data (especially before making financial decisions) with primary sources.
Maintain your organization: Keep your watchlists meaningful and avoid the “too many alerts” trap.
Stay mindful of biases: Just because you follow a stock and you like it, don’t ignore negative signals or news.
Refresh your knowledge periodically: Platforms evolve (as we’ve seen with the 2025 updates), so check for new features that might assist you.
FAQ
Q1: Is Google Finance free to use?
Yes — you can access the base functionality via finance.google.com and create watchlists, track stocks and use the Google Sheets integration without a paid subscription.
Q2: How accurate is the data?
Data is generally reliable for casual tracking, but note that quotes may be delayed (up to ~20 minutes) and some international exchanges or lesser‑known securities may have incomplete data. Google Help+1 Always verify before making any major investment decision.
Q3: Can I track my own portfolio performance?
Yes — you can use the watchlist feature to follow holdings. For more advanced tracking (including cost basis, dividends, performance over time), use Google Sheets with the GOOGLEFINANCE function to build a custom tracker.
Q4: How do I compare two stocks?
On a stock’s page within Google Finance, click the Compare option and select another security. A comparative chart of performance appears. You can also use Sheets to pull both sets of price data and do comparative analysis. Google Help
Q5: What asset classes does it support?
Google Finance primarily supports equities, ETFs, major indices, currencies and some commodities/cryptos (especially after the 2025 updates). It is less strong on bonds, options, exotic asset classes or very small foreign exchanges. Wikipedia+1
Q6: Can I set alerts for price drops or news events?
While Google Finance’s UI allows you to follow securities and monitor them in your watchlist, more granular alerting (e.g., push notifications upon price hitting a threshold) may require using Google Sheets + Apps Script or external alerting tools.
Q7: How do I pull historical prices into Google Sheets?
Use =GOOGLEFINANCE("TICKER", "attribute", start_date, end_date, interval) syntax. For example:
This returns an array of daily price data for the given period. Google Help
Conclusion
Google Finance is a versatile and accessible platform for anyone looking to keep a finger on the pulse of the markets. From building watchlists, comparing stocks, pulling historical data into Sheets, to leveraging the latest AI‑enhanced tools, it offers value for both beginners and more seasoned users. That said, like any tool, it has limits — especially when you move into highly technical or professional‑grade territory. Use it for its strengths: easy access, clean interface, integration with Google’s ecosystem — and complement it with additional tools when your research or trading demands deeper data.
Whether you’re investing for the long‑term, writing a company profile, or tracking sectors, Google Finance can become a key part of your workflow — if you use it intentionally, structure your data, and stay aware of its scope.


